Common continuous distributions and discrete distributions
Data Visualization
Big data visualization, such as dynamic plot of spatial data, take Covid-19 data as example
Confidence Interval
Dynamic demonstration of interval estimation, i.e., the change in confidence intervals of the overall mean and overall proportion with different samples the significance of the confidence level
Linear Regression
Explore the correlation between variables, including how correlation coefficients and regression equations change with changes in data distribution
Hypothesis Testing
Interative plot for identifing the p-values, Type I and Type II errors, and test efficacy
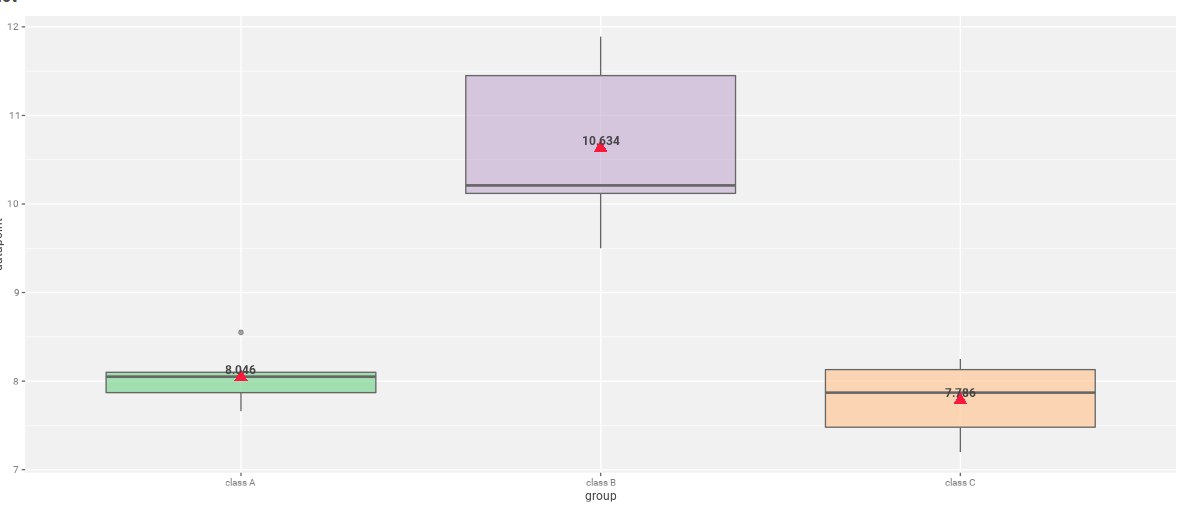
Analysis of Variance
One-way ANOVA to test for differences among the means of several populations(also referred to as "groups")